GUIs
Here, the GUIs that are available in the rimseval packages are described.
Note
This chapter does not describe the usage of the RIMSMEvalGUI,
which is a GUI around the whole package!
However, the GUIs described here are also used in the full RIMSEvalGUI.
The manual for that GUI can be found here
Mass calibration
The mass calibration GUI gives you a graphical user interface
to calibrate your masses and apply the mass calibration.
Assuming you have CRD file loaded into variable crd,
you can bring up the GUI as following:
from rimseval.guis import create_mass_cal_app
create_mass_cal_app(crd)
This will bring up a window similar to the following image.
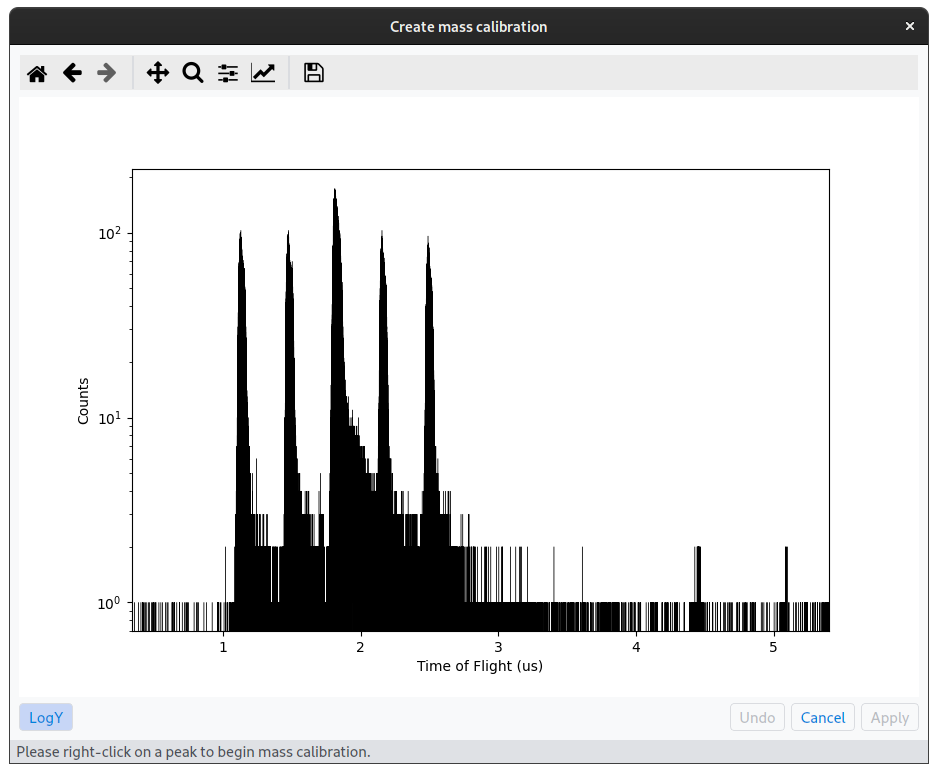
You can use the toolbar on top to zoom, etc. Use your mouse to right-click on a peak. This will bring up a window where you can either enter the mass of the peak or the isotope, e.g., as “46Ti”, “Ti46”, or “Ti-46”. Your entry is not case sensitive. If the peak was found, you can move on to define a second, third, etc. peak. After the second peak, the top axis will turn into a mass calibration axis. Press the apply button will use this mass calibration and apply it to your CRD file.
Integral drawing
Integrals can be defined by drawing in a matplotlib GUI.
Assuming you have a CRD file loaded into variable crd,
you can bring up the GUI as following:
from rimseval.guis import define_integrals_app
define_integrals_app(crd)
This will bring up a window similar to the following image. Note that several peaks have already been defined here.
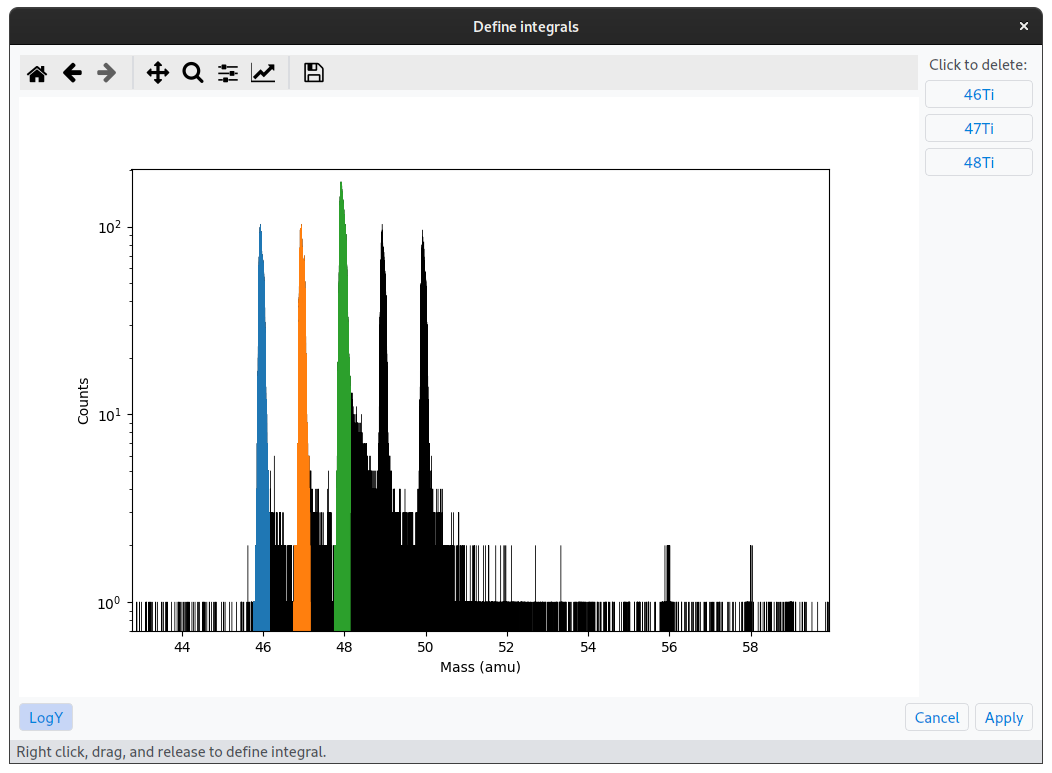
Press your right mouse button and hold it down in where you want to start the definition. Then sweep over the peak and let the mouse button go when you want to stop defining the integral. A window will ask you for an integral name. Once you click okay, the defined area will be shaded in a color and the peak name will appear in the list on the right. To delete a peak, simply press its name in the list on the right.
Note
When you click apply, the integral definition will be written to the CRD file. However, you still need to separate calculate the integrals, since this is not done automatically.
Background drawing
Similar to integrals, you can also define backgrounds
using a matplotlib GUI.
Assuming you have a CRD file loaded into variable crd,
you can bring up the GUI as following:
from rimseval.guis import define_backgrounds_app
define_backgrounds_app(crd)
Warning
Integral limits for at least one peak must be defined before you can define backgrounds.
This will bring up a wiwndow similar to the following image. Note that several backgrounds have already been defined.
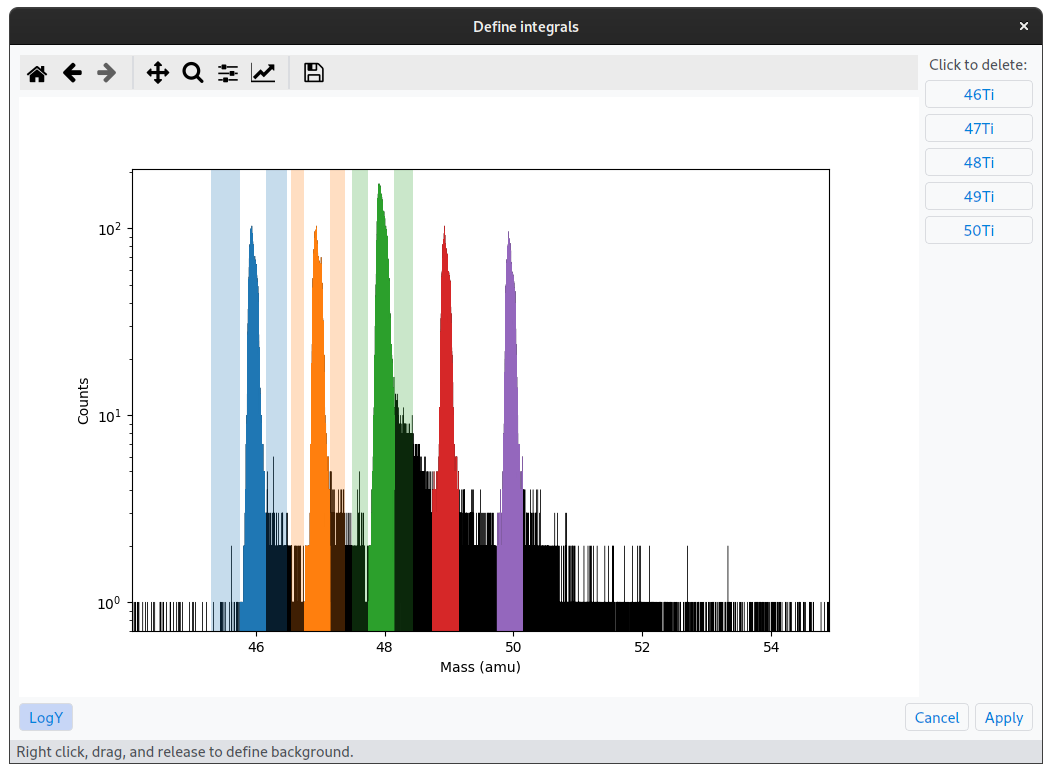
Press your right mouse button and hold it down where you want to start the background. Then sweep over the area you want to define as background and let the mouse button go when done. The GUI will bring up a window asking you for which peak this background applies.
Note
If you want to define a background to the left and right of the peak, you can simply do so by dragging the mouse over the peak. The GUI will automatically use your peak integral limits as the background limits and will define two backgrounds.
The background that is defined will then be shaded in the same color as the peak, but span the whole plot vertically and be lighter. If you want to delete all backgrounds for a peak, simply press the button on the right with the peak name.